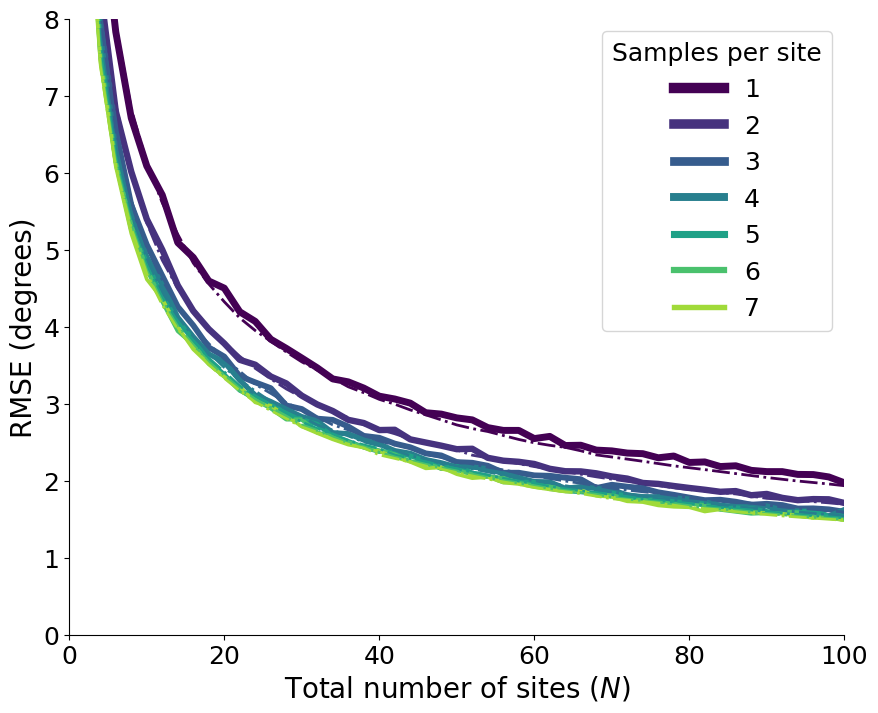
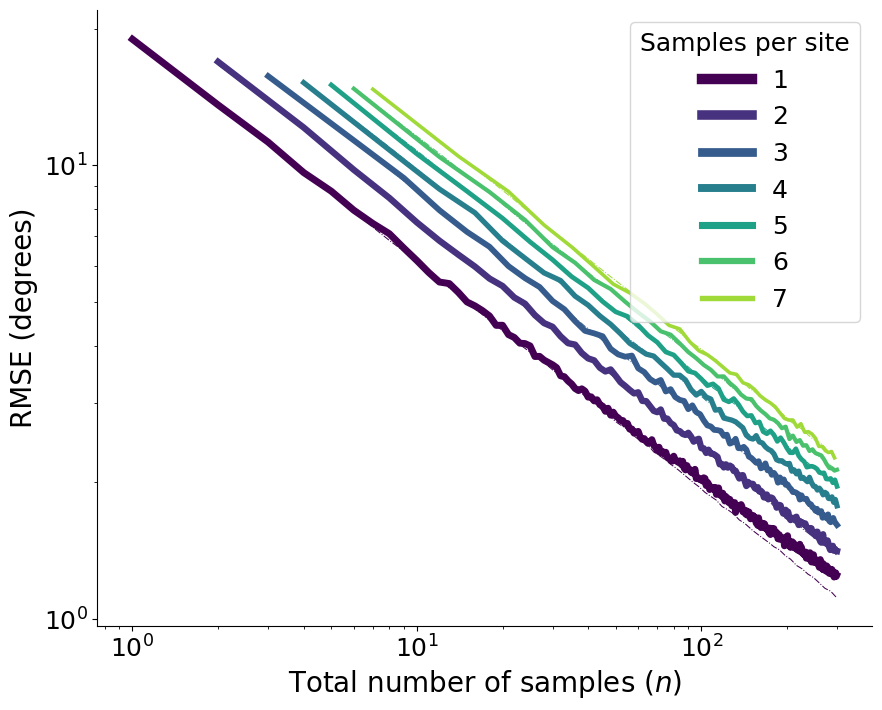
Figure 2: Decay as a function of the number of samples and sites#
These series of plots shows how the overall root mean squared error (RMSE) decays as we increase the number of totol samples and the number of sites for different choices of samples per site.
import numpy as np
import pandas as pd
import matplotlib.pyplot as plt
import seaborn as sns

import smpsite as smp

%matplotlib inline
1. Figures a & b: Decay as a function of the number of total samples \(n\)#
df = pd.read_csv('../../outputs/fig2ab_2000sim_summary.csv')
df
| Unnamed: 0 | Unnamed: 1 | error_angle_mean | error_angle_median | error_angle_25 | error_angle_75 | error_angle_95 | error_angle_std | error_angle_S2 | error_angle_S | ... | N | n0 | kappa_within_site | site_lat | site_long | outlier_rate | secular_method | kappa_secular | ignore_outliers | total_simulations | |
|---|---|---|---|---|---|---|---|---|---|---|---|---|---|---|---|---|---|---|---|---|---|
| 0 | 0 | 0 | 4.418425 | 4.068730 | 2.574621 | 5.931969 | 8.843983 | 2.389484 | 25.229262 | 5.022874 | ... | 10 | 3 | 50 | 30.0 | 0.0 | 0.0 | G | NaN | False | 2000 |
| 1 | 1 | 0 | 3.564401 | 3.307917 | 2.101149 | 4.756044 | 7.050093 | 1.916513 | 16.376137 | 4.046744 | ... | 24 | 1 | 50 | 30.0 | 0.0 | 0.0 | G | NaN | False | 2000 |
| 2 | 2 | 0 | 7.039044 | 6.605681 | 4.265727 | 9.247352 | 13.943720 | 3.726799 | 63.430232 | 7.964310 | ... | 4 | 3 | 50 | 30.0 | 0.0 | 0.0 | G | NaN | False | 2000 |
| 3 | 3 | 0 | 1.238532 | 1.158910 | 0.764595 | 1.644945 | 2.368667 | 0.645502 | 1.950427 | 1.396577 | ... | 229 | 1 | 50 | 30.0 | 0.0 | 0.0 | G | NaN | False | 2000 |
| 4 | 4 | 0 | 1.129028 | 1.053866 | 0.674889 | 1.512438 | 2.201005 | 0.590024 | 1.622659 | 1.273836 | ... | 277 | 1 | 50 | 30.0 | 0.0 | 0.0 | G | NaN | False | 2000 |
| ... | ... | ... | ... | ... | ... | ... | ... | ... | ... | ... | ... | ... | ... | ... | ... | ... | ... | ... | ... | ... | ... |
| 771 | 771 | 0 | 1.534570 | 1.439038 | 0.929228 | 2.031131 | 2.954905 | 0.789545 | 2.977974 | 1.725681 | ... | 87 | 3 | 50 | 30.0 | 0.0 | 0.0 | G | NaN | False | 2000 |
| 772 | 772 | 0 | 1.215589 | 1.158157 | 0.741750 | 1.638733 | 2.333324 | 0.615145 | 1.855872 | 1.362304 | ... | 242 | 1 | 50 | 30.0 | 0.0 | 0.0 | G | NaN | False | 2000 |
| 773 | 773 | 0 | 2.524885 | 2.360240 | 1.513693 | 3.397144 | 4.986915 | 1.338083 | 8.164615 | 2.857379 | ... | 35 | 2 | 50 | 30.0 | 0.0 | 0.0 | G | NaN | False | 2000 |
| 774 | 774 | 0 | 5.089531 | 4.711650 | 2.986586 | 6.697563 | 10.387042 | 2.796089 | 33.717527 | 5.806680 | ... | 11 | 1 | 50 | 30.0 | 0.0 | 0.0 | G | NaN | False | 2000 |
| 775 | 775 | 0 | 1.662648 | 1.569897 | 1.007462 | 2.204899 | 3.196883 | 0.861498 | 3.506206 | 1.872487 | ... | 117 | 1 | 50 | 30.0 | 0.0 | 0.0 | G | NaN | False | 2000 |
776 rows × 22 columns
df["error_kappa_theoretical"] = df.apply(lambda row: smp.kappa_theoretical(smp.Params(N=row.N,
                                                                                      n0=row.n0,
                                                                                      kappa_within_site=row.kappa_within_site,
                                                                                      site_lat=row.site_lat,
                                                                                      site_long=row.site_long,
                                                                                      outlier_rate=row.outlier_rate,
                                                                                      secular_method=row.secular_method,
                                                                                      kappa_secular=row.kappa_secular)), axis=1)
df["error_angle_theoretical"] = df.apply(lambda row: float(smp.kappa2angular(row.error_kappa_theoretical)), axis=1)
fig, ax = plt.subplots(figsize=(10,8))

log_scale = True

import matplotlib
palette = {x : matplotlib.cm.get_cmap('viridis')((x-1)/7) for x in np.arange(1,8)}

sizes = {i:5 - 0.4*(i-1) for i in range(1,8)}

sns.lineplot(ax=ax, data=df, x='n_tot', y='error_angle_S', hue='n0', size='n0', palette=palette, sizes=sizes)
sns.lineplot(ax=ax, data=df, x='n_tot', y='error_angle_theoretical', hue='n0', size=0.1, linewidth=2, palette=palette, legend=False, linestyle='dashdot')
# plt.xscale("log")

plt.xlabel("Total number of samples ($n$)", fontsize=20)
plt.ylabel("RMSE (degrees)", fontsize=20)
plt.yticks(fontsize=18)

leg = plt.legend(title="Samples per site", loc="upper right", fontsize=18, title_fontsize=18)
for i in range(7):
    leg.get_lines()[i].set_linewidth(1.5*sizes[i+1])
ax.spines[['right', 'top']].set_visible(False)

if log_scale:
    plt.xscale("log")
    plt.yscale("log")
    plt.xticks(fontsize=18)
    plt.savefig("Figure2b_log.pdf", format="pdf", bbox_inches='tight')
    plt.savefig("Figure2b_log.png", format="png", bbox_inches='tight')
else:
    plt.xticks([0, 50, 100, 150, 200, 250, 300], fontsize=18)
    plt.xlim(0, 300)
    plt.ylim(0, 8)
    plt.savefig("Figure2a.pdf", format="pdf", bbox_inches='tight')
    plt.savefig("Figure2a.png", format="png", bbox_inches='tight')
/tmp/ipykernel_2253/1007751571.py:6: MatplotlibDeprecationWarning: The get_cmap function was deprecated in Matplotlib 3.7 and will be removed in 3.11. Use ``matplotlib.colormaps[name]`` or ``matplotlib.colormaps.get_cmap()`` or ``pyplot.get_cmap()`` instead.
  palette = {x : matplotlib.cm.get_cmap('viridis')((x-1)/7) for x in np.arange(1,8)}
df["error_kappa_theoretical"] = df.apply(lambda row: smp.kappa_theoretical(smp.Params(N=row.N,
                                                                                      n0=row.n0,
                                                                                      kappa_within_site=row.kappa_within_site,
                                                                                      site_lat=row.site_lat,
                                                                                      site_long=row.site_long,
                                                                                      outlier_rate=row.outlier_rate,
                                                                                      secular_method=row.secular_method,
                                                                                      kappa_secular=row.kappa_secular)), axis=1)
df["error_angle_theoretical"] = df.apply(lambda row: float(smp.kappa2angular(row.error_kappa_theoretical)), axis=1)
Figure c & d: Decay as a function of the number of sites#
df = pd.read_csv('../../outputs/fig2cd_2000sim_summary.csv')
df
| Unnamed: 0 | Unnamed: 1 | error_angle_mean | error_angle_median | error_angle_25 | error_angle_75 | error_angle_95 | error_angle_std | error_angle_S2 | error_vgp_scatter | ... | N | n0 | kappa_within_site | site_lat | site_long | outlier_rate | secular_method | kappa_secular | ignore_outliers | total_simulations | |
|---|---|---|---|---|---|---|---|---|---|---|---|---|---|---|---|---|---|---|---|---|---|
| 0 | 0 | 0 | 3.507303 | 3.326483 | 2.133586 | 4.603671 | 6.762467 | 1.803921 | 15.553678 | 2.244988 | ... | 14 | 6 | 50 | 30.0 | 0.0 | 0.0 | G | NaN | False | 2000 |
| 1 | 1 | 0 | 1.824976 | 1.716661 | 1.092270 | 2.457725 | 3.515834 | 0.944936 | 4.222996 | 1.319370 | ... | 70 | 2 | 50 | 30.0 | 0.0 | 0.0 | G | NaN | False | 2000 |
| 2 | 2 | 0 | 2.755531 | 2.596467 | 1.664463 | 3.666091 | 5.281088 | 1.430537 | 9.638365 | 2.061391 | ... | 30 | 2 | 50 | 30.0 | 0.0 | 0.0 | G | NaN | False | 2000 |
| 3 | 3 | 0 | 3.865201 | 3.690096 | 2.323372 | 5.129322 | 7.579034 | 2.014398 | 18.995552 | 2.327094 | ... | 12 | 7 | 50 | 30.0 | 0.0 | 0.0 | G | NaN | False | 2000 |
| 4 | 4 | 0 | 2.231617 | 2.061765 | 1.363932 | 2.949242 | 4.350726 | 1.154125 | 6.311454 | 1.434520 | ... | 36 | 5 | 50 | 30.0 | 0.0 | 0.0 | G | NaN | False | 2000 |
| ... | ... | ... | ... | ... | ... | ... | ... | ... | ... | ... | ... | ... | ... | ... | ... | ... | ... | ... | ... | ... | ... |
| 352 | 352 | 0 | 2.462295 | 2.297074 | 1.502908 | 3.300662 | 4.778267 | 1.280982 | 7.702988 | 1.632359 | ... | 32 | 4 | 50 | 30.0 | 0.0 | 0.0 | G | NaN | False | 2000 |
| 353 | 353 | 0 | 1.979653 | 1.858608 | 1.168008 | 2.691842 | 3.864772 | 1.057756 | 5.037314 | 1.223433 | ... | 44 | 7 | 50 | 30.0 | 0.0 | 0.0 | G | NaN | False | 2000 |
| 354 | 354 | 0 | 1.361468 | 1.278077 | 0.825126 | 1.807194 | 2.679220 | 0.722299 | 2.375049 | 0.878151 | ... | 98 | 4 | 50 | 30.0 | 0.0 | 0.0 | G | NaN | False | 2000 |
| 355 | 355 | 0 | 2.096491 | 1.979148 | 1.295316 | 2.769094 | 4.051376 | 1.073121 | 5.546288 | 1.378519 | ... | 46 | 3 | 50 | 30.0 | 0.0 | 0.0 | G | NaN | False | 2000 |
| 356 | 356 | 0 | 1.515558 | 1.421238 | 0.915071 | 2.030036 | 2.954767 | 0.801870 | 2.939590 | 0.954425 | ... | 80 | 5 | 50 | 30.0 | 0.0 | 0.0 | G | NaN | False | 2000 |
357 rows × 21 columns
df["error_angle_S"] = df["error_angle_S2"] ** .5

df["error_kappa_theoretical"] = df.apply(lambda row: smp.kappa_theoretical(smp.Params(N=row.N,
                                                                                    n0=row.n0,
                                                                                    kappa_within_site=row.kappa_within_site,
                                                                                    site_lat=row.site_lat,
                                                                                    site_long=row.site_long,
                                                                                    outlier_rate=row.outlier_rate,
                                                                                    secular_method=row.secular_method,
                                                                                    kappa_secular=row.kappa_secular)), axis=1)
df["error_angle_theoretical"] = df.apply(lambda row: float(smp.kappa2angular(row.error_kappa_theoretical)), axis=1)
fig, ax = plt.subplots(figsize=(10,8))

log_scale = False
plot_theory = True

import matplotlib
palette = {x : matplotlib.cm.get_cmap('viridis')((x-1)/7) for x in np.arange(1,8)}

sizes = {i:5 - 0.4*(i-1) for i in range(1,8)}

sns.lineplot(ax=ax, data=df, x='N', y='error_angle_S', hue='n0', size='n0', palette=palette, sizes=sizes)
if plot_theory:
    sns.lineplot(ax=ax, data=df, x='N', y='error_angle_theoretical', hue='n0', linewidth=2, palette=palette, legend=False, linestyle='dashdot')


plt.xlabel("Total number of sites ($N$)", fontsize=20)
plt.ylabel("RMSE (degrees)", fontsize=20)
plt.yticks(fontsize=18)

leg = plt.legend(title="Samples per site", loc="upper right", fontsize=18, title_fontsize=18)
for i in range(7):
    leg.get_lines()[i].set_linewidth(1.5*sizes[i+1])
ax.spines[['right', 'top']].set_visible(False)

if log_scale:
    plt.xscale("log")
    plt.yscale("log")
    plt.xticks(fontsize=18)
    plt.savefig("Figure2d_log.pdf", format="pdf", bbox_inches='tight')
    plt.savefig("Figure2d_log.png", format="png", bbox_inches='tight')
else:
    plt.xticks(np.arange(0, 101, 20), fontsize=18)
    plt.xlim(0, 100)
    plt.ylim(0, 8)
    plt.savefig("Figure2c.pdf", format="pdf", bbox_inches='tight')
    plt.savefig("Figure2c.png", format="png", bbox_inches='tight')
/tmp/ipykernel_2253/3024017231.py:7: MatplotlibDeprecationWarning: The get_cmap function was deprecated in Matplotlib 3.7 and will be removed in 3.11. Use ``matplotlib.colormaps[name]`` or ``matplotlib.colormaps.get_cmap()`` or ``pyplot.get_cmap()`` instead.
  palette = {x : matplotlib.cm.get_cmap('viridis')((x-1)/7) for x in np.arange(1,8)}