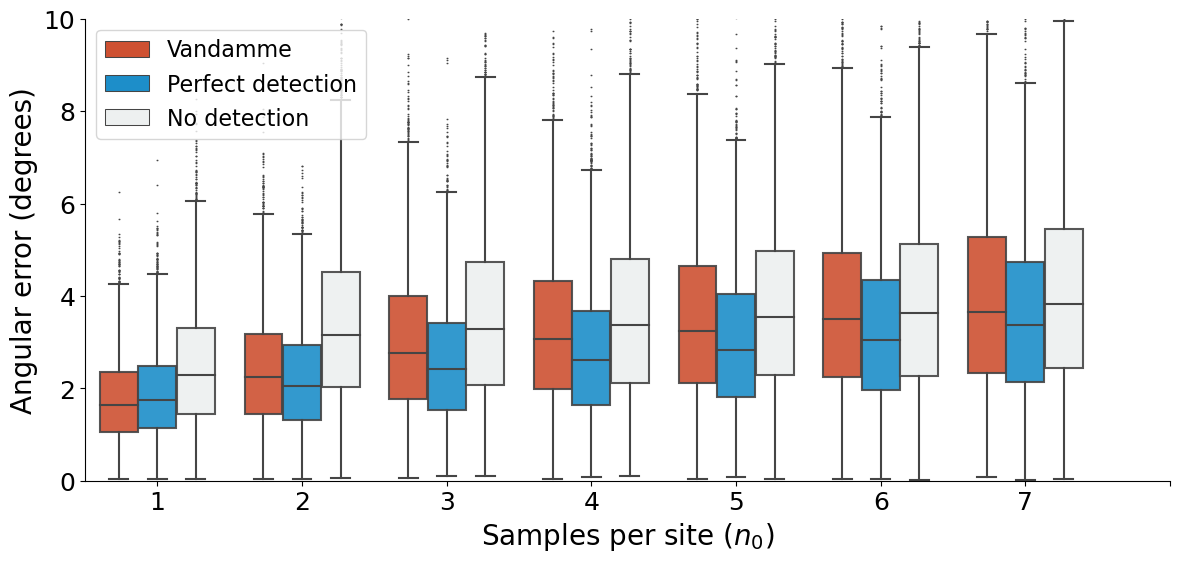
Figure 4: Boxplot#
import numpy as np
import pandas as pd
import matplotlib.pyplot as plt
import seaborn as sns

from scipy.interpolate import InterpolatedUnivariateSpline

import smpsite as smp

%matplotlib inline
ERROR 1: PROJ: proj_create_from_database: Open of /srv/conda/envs/notebook/share/proj failed
df = pd.read_csv("../../outputs/fig4_5000sim_total.csv")
df
| Unnamed: 0 | plong | plat | total_samples | samples_per_sites | S2_vgp | error_angle | S2_vgp_real | n_tot | N | n0 | kappa_within_site | site_lat | site_long | outlier_rate | secular_method | kappa_secular | ignore_outliers | hash | |
|---|---|---|---|---|---|---|---|---|---|---|---|---|---|---|---|---|---|---|---|
| 0 | 0 | 231.233958 | 89.078084 | 100.0 | 2 | 258.092561 | 0.921916 | 191.7229 | 100 | 50 | 2 | 50 | 30.0 | 0.0 | 0.0 | G | NaN | True | -8335591600388957984 |
| 1 | 1 | 63.804499 | 89.231872 | 100.0 | 2 | 181.571799 | 0.768128 | 191.7229 | 100 | 50 | 2 | 50 | 30.0 | 0.0 | 0.0 | G | NaN | True | -8335591600388957984 |
| 2 | 2 | 291.665245 | 87.059161 | 100.0 | 2 | 179.071413 | 2.940839 | 191.7229 | 100 | 50 | 2 | 50 | 30.0 | 0.0 | 0.0 | G | NaN | True | -8335591600388957984 |
| 3 | 3 | 330.248972 | 87.105972 | 100.0 | 2 | 163.079929 | 2.894028 | 191.7229 | 100 | 50 | 2 | 50 | 30.0 | 0.0 | 0.0 | G | NaN | True | -8335591600388957984 |
| 4 | 4 | 38.224125 | 87.075199 | 100.0 | 2 | 218.421320 | 2.924801 | 191.7229 | 100 | 50 | 2 | 50 | 30.0 | 0.0 | 0.0 | G | NaN | True | -8335591600388957984 |
| ... | ... | ... | ... | ... | ... | ... | ... | ... | ... | ... | ... | ... | ... | ... | ... | ... | ... | ... | ... |
| 524995 | 4995 | 148.732544 | 84.169662 | 96.0 | 6 | -155.962415 | 5.830338 | 191.7229 | 102 | 17 | 6 | 50 | 30.0 | 0.0 | 0.4 | G | NaN | vandamme | 2995613283241899664 |
| 524996 | 4996 | 57.944083 | 88.316125 | 84.0 | 6 | -296.623262 | 1.683875 | 191.7229 | 102 | 17 | 6 | 50 | 30.0 | 0.0 | 0.4 | G | NaN | vandamme | 2995613283241899664 |
| 524997 | 4997 | 332.897508 | 82.935519 | 96.0 | 6 | 205.145417 | 7.064481 | 191.7229 | 102 | 17 | 6 | 50 | 30.0 | 0.0 | 0.4 | G | NaN | vandamme | 2995613283241899664 |
| 524998 | 4998 | 289.433482 | 82.479833 | 96.0 | 6 | -27.928311 | 7.520167 | 191.7229 | 102 | 17 | 6 | 50 | 30.0 | 0.0 | 0.4 | G | NaN | vandamme | 2995613283241899664 |
| 524999 | 4999 | 315.637990 | 86.584133 | 90.0 | 6 | 58.631713 | 3.415867 | 191.7229 | 102 | 17 | 6 | 50 | 30.0 | 0.0 | 0.4 | G | NaN | vandamme | 2995613283241899664 |
525000 rows × 19 columns
fig, ax = plt.subplots(figsize=(14,6))

outlier_rate = .10

df_ = df[df.outlier_rate == outlier_rate]

def rename_outlier_method(x):
    if x == "vandamme":
        return "Vandamme"
    elif x == "False":
        return "No detection"
    elif x == "True":
        return "Perfect detection"
    else:
        raise ValueError()

df_["Sampling Strategy"] = df_.apply(lambda row : rename_outlier_method(row.ignore_outliers), axis=1)

my_pal = {"Vandamme": "#e84118",
          "No detection": "#ecf0f1",
          "Perfect detection": "#0097e6"}

hue_order = ["Vandamme", "Perfect detection", "No detection"]

# create grouped boxplot
sns.boxplot(data = df_,
            x = 'samples_per_sites',
            y = 'error_angle',
            hue = 'Sampling Strategy',
            hue_order = hue_order,
            palette=my_pal,
            fliersize=0.4,
            boxprops=dict(alpha=.9),
            width=0.8,
            #orient = "h",
            ax=ax)

plt.legend(loc='upper left', fontsize=16)
ax.set_ylim(0,10)

plt.xlabel("Samples per site ($n_0$)", fontsize=20)
plt.ylabel("Angular error (degrees)", fontsize=20)
plt.yticks(fontsize=18)
plt.xticks([0,1,2,3,4,5,6,7], fontsize=18)

ax.spines[['right', 'top']].set_visible(False)

#plt.savefig("Figure4_{}.pdf".format(outlier_rate), format="pdf", bbox_inches='tight')
#plt.savefig("Figure4_{}.png".format(outlier_rate), format="png", bbox_inches='tight')
/tmp/ipykernel_3098/4131771631.py:17: SettingWithCopyWarning:
A value is trying to be set on a copy of a slice from a DataFrame.
Try using .loc[row_indexer,col_indexer] = value instead

See the caveats in the documentation: https://pandas.pydata.org/pandas-docs/stable/user_guide/indexing.html#returning-a-view-versus-a-copy
  df_["Sampling Strategy"] = df_.apply(lambda row : rename_outlier_method(row.ignore_outliers), axis=1)
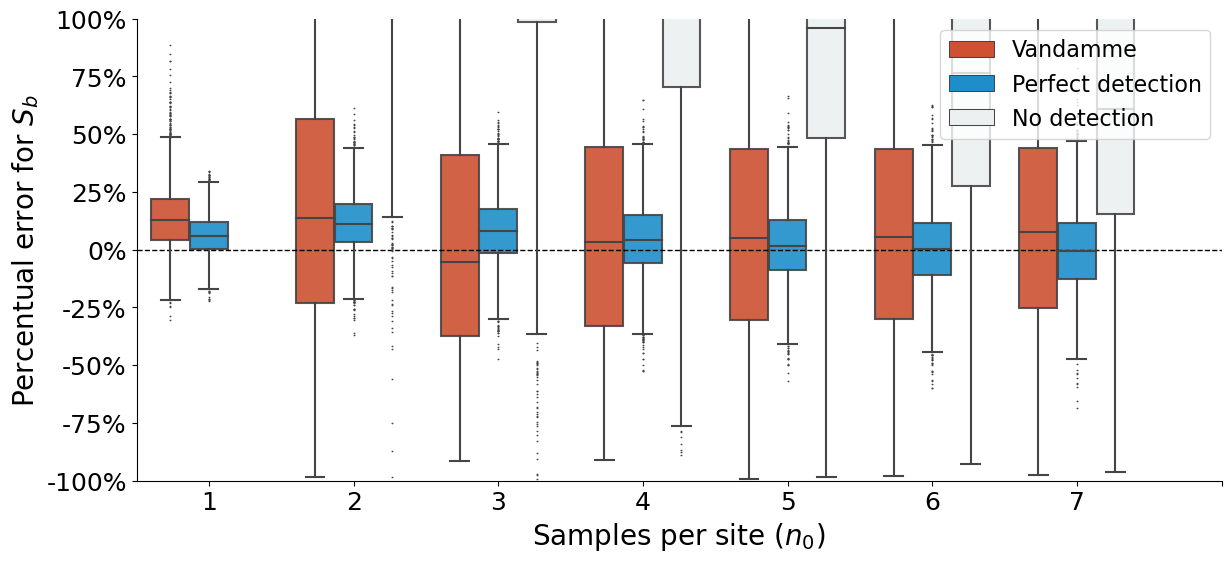
VGP scatter#
fig, ax = plt.subplots(figsize=(14,6))

df["error_S_vgp"] = (df.S2_vgp ** .5 - df.S2_vgp_real ** .5) / df.S2_vgp_real ** .5 * 100

outlier_rate = .4

df_ = df[df.outlier_rate == outlier_rate]

def rename_outlier_method(x):
    if x == "vandamme":
        return "Vandamme"
    elif x == "False":
        return "No detection"
    elif x == "True":
        return "Perfect detection"
    else:
        raise ValueError()

df_["Sampling Strategy"] = df_.apply(lambda row : rename_outlier_method(row.ignore_outliers), axis=1)

my_pal = {"Vandamme": "#e84118",
          "No detection": "#ecf0f1",
          "Perfect detection": "#0097e6"}

hue_order = ["Vandamme", "Perfect detection", "No detection"]

plt.axhline(y=0, color = 'black', ls="--", lw=1)

# create grouped boxplot
sns.boxplot(data = df_,
            x = 'samples_per_sites',
            y = 'error_S_vgp',
            hue = 'Sampling Strategy',
            hue_order = hue_order,
            palette=my_pal,
            fliersize=0.4,
            boxprops=dict(alpha=.9),
            width=0.8,
            #orient = "h",
            ax=ax)

plt.legend(loc='upper right', fontsize=16)
ax.set_ylim(-1,1)

plt.xlabel("Samples per site ($n_0$)", fontsize=20)
plt.ylabel("Percentual error for $S_b$", fontsize=20)
plt.yticks(fontsize=18)
plt.xticks([0,1,2,3,4,5,6,7], fontsize=18)
plt.yticks([-100, -75, -50, -25, 0, 25, 50, 75, 100], [ "-100%", "-75%", "-50%","-25%","0%","25%","50%","75%", "100%"])


ax.spines[['right', 'top']].set_visible(False)

plt.savefig("Figure5_{}.pdf".format(outlier_rate), format="pdf", bbox_inches='tight')
plt.savefig("Figure5_{}.png".format(outlier_rate), format="png", bbox_inches='tight')
/tmp/ipykernel_3098/2634743452.py:19: SettingWithCopyWarning:
A value is trying to be set on a copy of a slice from a DataFrame.
Try using .loc[row_indexer,col_indexer] = value instead

See the caveats in the documentation: https://pandas.pydata.org/pandas-docs/stable/user_guide/indexing.html#returning-a-view-versus-a-copy
  df_["Sampling Strategy"] = df_.apply(lambda row : rename_outlier_method(row.ignore_outliers), axis=1)